Long-term records track climate change effects on Alaska’s North Slope
Haley Dunleavy
907-474-6407
Dec. 14, 2022

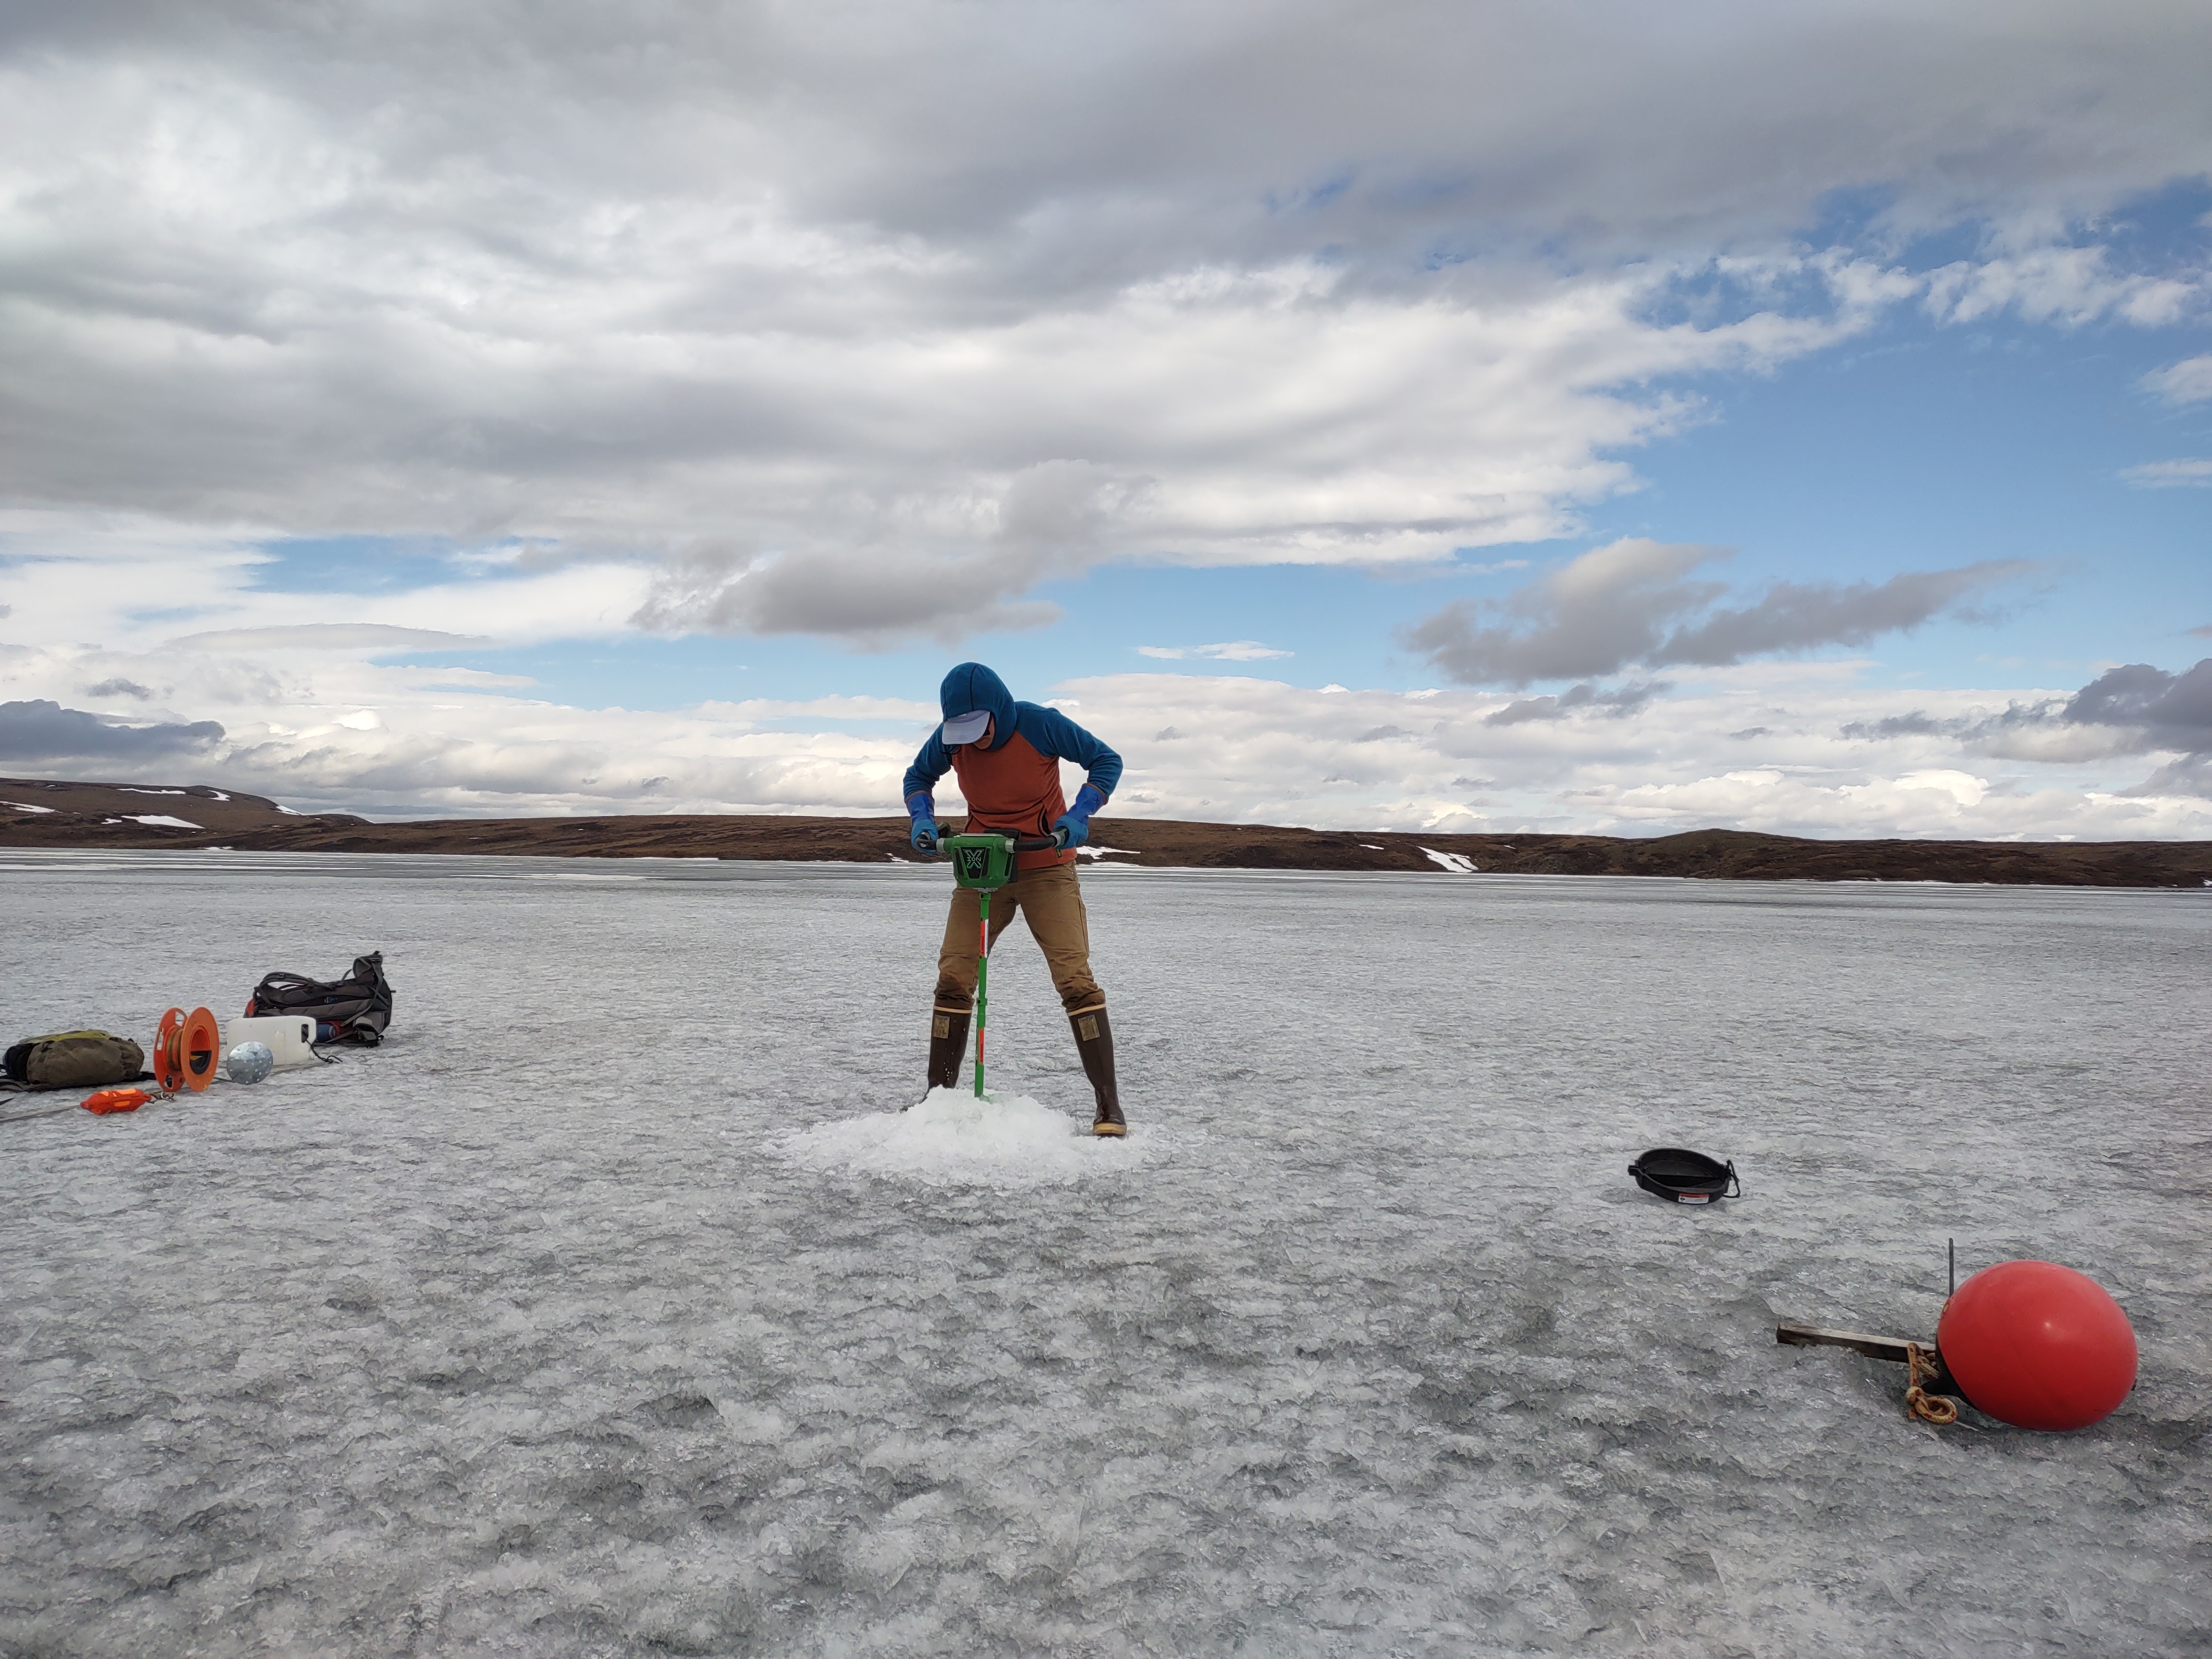
Toolik Field Station staff member Mayra Melendez Gonzalez drills into the ice on Toolik Lake to measure its thickness for long-term records in June 2022.
For 15 years, staff at the ÿƒ∑ ”∆µ Toolik Field Station, located
north of the Brooks Range, have kept a close eye on the tundra’s daily activity. They
record everything from lake ice thickness and precipitation to the date when each
year’s first blueberry ripens. It’s a practice that’s left Amanda Young, a co-principal
investigator for Toolik, questioning what “normal” means in a rapidly changing Arctic,
especially when temperatures unseasonably rose above freezing earlier this month.
These consistent records of daily to weekly environmental variation may seem mundane,
but, together, they tell a story about the changing tundra that large-scale models
and one-time sampling campaigns miss. By having this long-term record of change, Young
said in a poster she’s presenting at the American Geophysical Union’s 2022 fall meeting,
“visiting researchers can get a better idea of where their shorter-term projects fall
into the larger picture and avoid misinterpreting their findings.”
Often, the data will show connections between seemingly disparate variables, said
Young. For example, an abnormally large snowstorm in May 2015 might be the reason
savannah sparrow and Lapland longspur populations noticeably dropped in 2016.
Young said the biggest trend occurred in deep permafrost soils, where temperatures
are warming, a concerning early indicator of permafrost thaw.
“These are the things people have been measuring for ages,” Young said. “They’re useful
for science because they show how the plants, animals, microbes and everything else
are responding in the landscape. But these parameters also influence how we live on
the landscape.”
These datasets are available to access and explore via the Toolik website.


